Your Guide to Sieve Analysis of Sand | Horse Arena Sand
Master the sieve analysis of sand process using our arena sand guide. Improve your arena footing and get reliable results for better arena performance.
Anytime you are working with sand or rocks, it is important to know how to read a sand sieve. One of the most common ways to do this is with a process called sand sieve analysis. Here, we will explain what sieve analysis is and provide a guide for performing and reading a sand sieve analysis.
What Is Sand Sieve Analysis?
Sieve analysis is the process of classifying soil and rock particles by their size and weight. During the analysis, a soil or rock sample is passed through different-sized sieves. The material left behind in each sieve indicates the size distribution of the soil and rock particles.
Sieve analysis of sand is a popular method that determines the particle size distribution for granular materials. In this process, a sand sample is pushed through a group of finer sieves. Then, the sand that is left behind is weighed. The results are used to determine the size distribution curve.
The size distribution curve helps assess the sand’s grade—an important factor in construction and engineering projects. After analyzing the sand’s particle size distribution, engineers better understand how sustainable the particles will be in different applications.
How is a Sieve Analysis Test Performed?
To perform a sand sieve analysis, most quarries employ professionals that will use the following:
- standard sieves
- a mechanical sieve shaker
- a balance
The sieves have metal screens with different mesh sizes. The mechanical sieve shaker separates the particles. The balance weighs the samples before and after sieving.
The sieve analysis results are presented as a graph that shows the cumulative percentage of materials remaining on each sieve. Engineers and horse arena installers use the graph to assess the grading of the fine aggregate and how suitable it will be for different construction uses.
The temperature of the sand sample that is being analyzed can affect the results of the sieve analysis. ASTM standards require the sand sample be dried at a temperature of 100 degrees Celsius before the sieve analysis begins. This helps ensure accuracy.
The Purpose of Sand Sieve Analysis
The goal of sand sieve analysis is to determine the size distribution of particles in a sample of sand or fine aggregate. This is important for arena construction because particle size distribution can impact material properties like strength and workability.
During the analysis, the sand sample is passed through a series of sieves with smaller openings. The amount of sand remaining on each sieve is then recorded. This data is used to construct a graph showing the percentage of large sand particles.
The graph helps you identify any irregularities in the sand particle’s size distribution, which can affect its suitability for your horse arena. For example, if the sand contains too many large particles, it may not be compact enough and conversely if it contains too many small particles, it may get too compacted.
The ultimate goal of sand sieve analysis is to make sure the sand or fine aggregate has a consistent particle size distribution that is appropriate for its use in your arena.
Sieve Analysis Test Procedure
For those who really want to get into the engineering details, there are several steps to performing a sand sieve analysis. These are best practices, and usually followed by most reputable rock quarries:
- Choose a sample of the material to be tested.
- Weigh the sample.
- Record the weight.
- Place the sample on the top sieve of the stack.
- Turn on the mechanical sieve shaker.
- Weigh each sieve and record the weight of the materials collected in it.
- Repeat these steps for each sieve in the stack.
- Calculate the percentage of material.
- Plot a equipment curve.
Once this process is noted, you can calculate the percentage of material retained on each sieve, using this formula:
% Retained = (Weight of Material Retained on Sieve / Weight of Initial Sample) x 100
Arena Sand for Dressage
When choosing sand for your dressage arena, the sieve report plays a crucial role in ensuring you get the right texture and performance. Here’s what to look for in the report:
Particle Size Distribution:
- Ideal Range: Dressage typically requires a medium to fine sand with particle sizes ranging from 0.42 mm to 2.0 mm (sieve #40 to #10). This provides a balance between traction, shock absorption, and dust control.
- Fines (<0.074 mm): Excessive fines (silt/clay) can create a dusty, sticky surface with poor drainage. Aim for less than 5% fines in the report.
- Coarse Particles (>4.76 mm): Too many large particles can make the surface uneven and uncomfortable for horses. Ideally, keep coarse particles below 10% in the report.
Uniformity:
- Coefficient of Uniformity (CU): Look for a CU between 2 and 5. This indicates a well-graded sand with a good mix of different particle sizes, promoting stability and drainage.
- Coefficient of Curvature (CC): Aim for a CC between 1 and 1.5. This signifies a well-distributed particle size range, preventing excessive loose or packed areas.
Additional Factors:
- Angularity: Look for subangular sand particles in shape
- Organic Matter: Avoid sand with high organic content (>2%), as it can decompose and create unwanted odors and drainage issues.
- pH: Maintain a neutral pH (between 6.5 and 7.5) to prevent skin irritation for horses and support microbial activity.
Remember:
- The ideal sieve report might differ slightly depending on your specific needs and riding style. Consider consulting with a footing expert at Performance Footing or a dressage trainer for personalized recommendations.
- Regularly monitor your arena sand and replenish/adjust as needed based on usage and sieve reports.
- Additives to your arena can help both the stability and enjoyability. When used with good sand, you can benefit from less watering, more rebound, and stability using products like Levitare, FoamFooting, or FIBR.
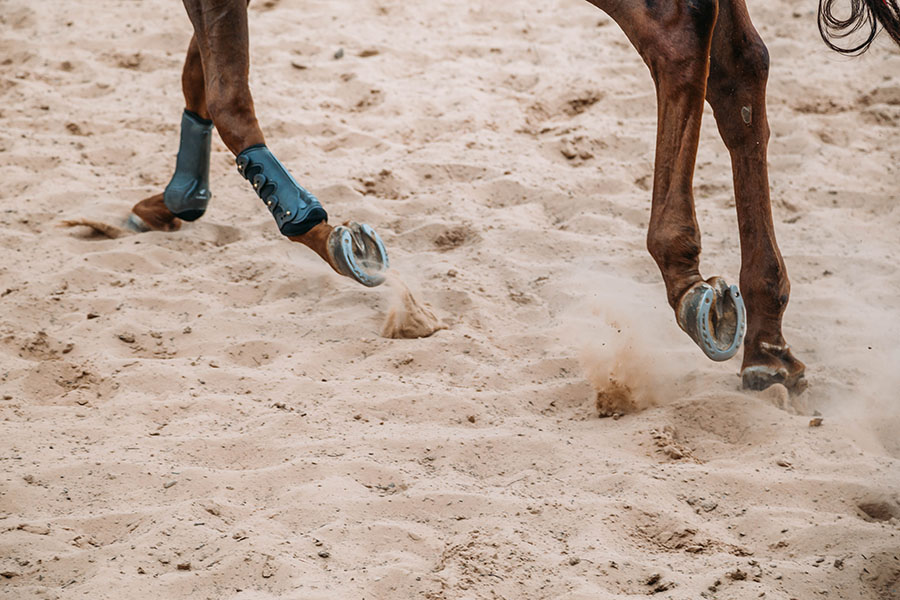
Arena Sand for Jumping and Eventing
When choosing sand for a jumping or eventing arena, the criteria are similar to dressage, but with some key differences based on the demands of these disciplines:
Particle Size Distribution:
- Jumping: A slightly coarser sand may be preferred compared to dressage, typically in the range of 0.6 mm to 3.15 mm (sieve #30 to #6). This provides better footing for take-off and landing during jumps. Fines should still be under 5%, and coarse particles below 10%.
- Eventing: Cross-country phases might require even slightly coarser sand than jumping, up to 4.76 mm (sieve #4) for good support and traction on varied terrain. Still aim for less than 5% fines and limit coarse particles.
Uniformity:
- Both jumping and eventing emphasize good drainage and stability. Maintain a Coefficient of Uniformity (CU) between 2 and 5 and a Coefficient of Curvature (CC) between 1 and 1.5.
Additional Factors:
- Angularity: Subangular is still preferred for compacting and stabilization
- Organic Matter: Keep organic content low for both disciplines.
- pH: A neutral pH is ideal.
Specific Considerations:
- Landing Areas: For jumping areas, consider using slightly finer sand or adding a footing additive like Levitare or FoamFooting on top of the base sand for better shock absorption.
- Cross-Country: Some courses might benefit from different sand additives in specific areas depending on obstacles and terrain.
- Drainage: Good drainage is crucial for all arenas. Consider items like BaseCore and PaveCore to help the underlying soil and drainage systems when choosing sand.
Remember, consulting an equestrian footing expert at Performance Footing or your trainer can provide valuable insights to optimize your sand selection based on your specific needs and competition level. Regularly monitoring and adjusting the sand and any additives based on usage and sieve reports remains essential for maintaining a safe and functional arena.
What to look for in your sand in Western disciplines
When choosing sand for western disciplines, the ideal characteristics differ again due to the unique demands of these styles of riding. Here’s what to look for in a sieve report for a western arena:
Particle Size Distribution:
- Overall Range: Western arenas typically require a medium to coarse sand ranging from 0.85 mm to 4.76 mm (sieve #20 to #4). This provides the necessary traction for stopping, sliding, and quick turns.
- Fines (<0.074 mm): Keep fines very low, ideally under 2%, to minimize dust and maintain good drainage.
- Coarse Particles (>4.76 mm): While some coarse particles are acceptable for traction, limit them to around 10% to prevent an uneven surface.
Uniformity:
- Coefficient of Uniformity (CU): Aim for a CU between 2 and 4. A slightly narrower range compared to other disciplines can help create a consistent surface for sliding stops and spins.
- Coefficient of Curvature (CC): Maintain a CC between 1 and 1.5 for good drainage and stability.
Additional Factors:
- Angularity: Subangular sand is preferred for stability.
- Organic Matter: Keep organic content low for better drainage and odor control.
- pH: A neutral pH is ideal.
Specific Considerations:
- Discipline Focus: If you primarily focus on barrel racing or reining, consider a slightly finer sand within the range to provide more consistent footing for fast maneuvers.
- Clay Mix: Some western riders prefer adding a small amount of clay to the sand mixture for surface stability. However, this also promotes more dust. Look at products like DustHalt to assist and ensure proper drainage if using clay.
- Dust Control: Dust can be a significant concern, particularly in indoor arenas. Choose sand with low dust potential and consider additional dust control measures like DustHalt or additives like Levitare.
Consulting with a footing specialist at Performance Footing, your trainer or expert familiar with your specific discipline can provide valuable insights into sand selection based on your riding style and preferred footing characteristics.
Example Sieve Analysis Reports for Arena Sand
Here are some example sieve analysis reports for different arena types, along with explanations of their key features:
1. Dressage Arena:
Particle Size Distribution: This report shows a well-graded sand with a majority of particles falling within the ideal range for dressage (0.42mm to 2.0mm). The fines content is low (2.7%) and coarse particles are minimal (7.2%).
Uniformity: The Coefficient of Uniformity (CU) of 3.2 and Coefficient of Curvature (CC) of 1.3 indicate a well-distributed particle size range, promoting good drainage and stability.
2. Jumping Arena:
Particle Size Distribution: This report shows a slightly coarser sand compared to the dressage example, with a higher percentage of particles in the 0.6mm to 3.15mm range suitable for jumping. Fines content remains low (3.1%) and coarse particles are within the recommended limit (8.5%).
Uniformity: The CU of 2.8 and CC of 1.2 demonstrate good uniformity, ensuring consistent footing for take-offs and landings.
3. Western Arena:
Particle Size Distribution: This report reflects a coarser sand suitable for western disciplines, with a majority of particles in the 0.85mm to 4.76mm range. Fines content is very low (1.5%) and coarse particles are slightly higher (12.1%) to provide good traction.
Uniformity: The CU of 3.5 and CC of 1.4 indicate a slightly narrower particle size range compared to jumping sand, potentially aiding sliding maneuvers.
Remember: These are just examples, and the ideal sieve analysis report may vary depending on specific needs and preferences. Always consult with an expert for personalized recommendations based on your arena type, riding style, and local conditions.